The Borough of Finsbury Bomb Sketches
The modern London Borough of Islington used to consist of three separate boroughs, Islington, Finsbury and Clerkenwell. They each recorded their bomb damage in a different way, so that our modern Islington Local History Archive should hold what remains of three different systems.
The original London Borough of Islington had a separate card for each street, with the dated incidents all together. To find the effect of the bombing on any particular area, one needs to consult the street cards of all the local streets.

Some typical Islington Bombing Incident in neighbouring street cards.
The Borough of Finsbury typed out a daily list of all the incidents in the borough, so that the full damage details of any particular street may be spread over several pages, perhaps years apart. The Borough of Clerkenwell records, if they still exist, are not held in the Islington History Archive.
Bomb Damage in the Borough of Finsbury
The yellowing Finsbury sheets list all the damage suffered in a single 24 hours and some of them are startling. They bring home the intensity of the bombing on a particular day in a way that is frightening.
A parachute mine and high explosive bombs fell on Holford Square and Percy Circus, doing immense damage. The sheets below list each building and the approximate damage.

++Photograph the second sheet
The report page for the 24 hours ending 15th May 1941? states:-
| ‘Parachute mine and H.E. bombs fell in Holford Square and Percy Circus causing widespread devastation in immediate vicinity and considerable damage by blast to buildings over a large area of the Borough.’ |
The sheets shown list each building and the approximate damage caused. The list goes on and on. No doubt the parachute prevented that bomb from penetrating the ground and its blast effect spread sideways, not upwards, causing damage to houses over a wide area. The high explosives increased this damage, so that the total destruction was extreme.
After The Second World War.
The Creation of the 1939-45 War Damage Maps,
so that the Rebuilding of London could be planned properly.
 |
||
| Whole Map | Larger Area | Larger Area Map in New Window |
 |
||
| Whole Map | Larger Area | Larger Area Map in New Window |
Local Boroughs knew the damage in their own area, but a full picture was needed so that repair, demolition and rebuilding could be organised. People were desperate for homes. Town Halls were full of people demanding accommodation, so planning and the best allocation of scare building materials were urgent and the pressure to work quickly was intense.
By a lucky chance Finsbury has left us a few sketches which show how the final Bomb Damage Maps were compiled. Each borough must have been asked by the London County Council to make detailed sketches of their own damage. Architects and assistants traced small areas of the Ordnance Survey maps in Indian ink, coloured them in to show the degrees of the damage to each property, and sent them in. By doing it in small patches, the work could be shared out in the local offices and the task completed quickly. This was decades before coloured photocopiers, so the small pieces of map, with the damage marked with coloured pencil, were sent off to County Hall to be built up into the Bombing Maps we have today. The final maps became the basis for the Abercrombie Plan for the re-planning of London. No doubt most of the local sketches were then thrown away but by chance, about half a dozen Finsbury ones have survived.
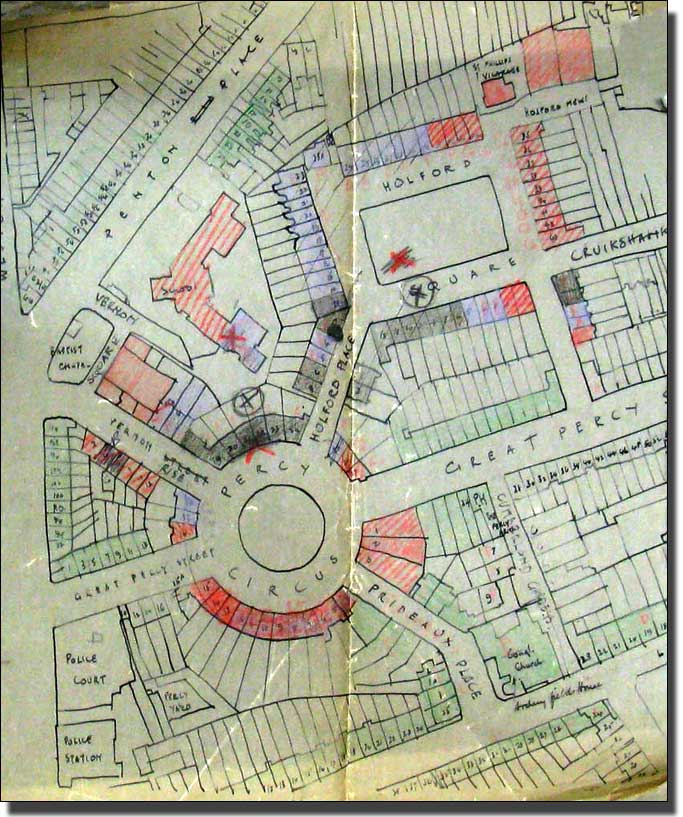
The War Damage to Percy Circus and Holford Square
Drawn of tracing paper and with the degrees of damage coloured in.
All these sketch maps are reproduced by courtesy of Islington History Archive.
In 2005 ‘The London County Council BOMB DAMAGE MAPS, 1939-1945’ were printed by the London Topographical Society. This volume is invaluable and some small pieces have been reproduced here by kind permission of London Metropolitan Archive which owns the copyright. The book is out of print but a number of people have put down their names for copies if and when it is reprinted. Try the Internet but expect to pay a good price. It is a rare book.
 |
||
| Whole Map | Larger Area | Larger Area Map in New Window |
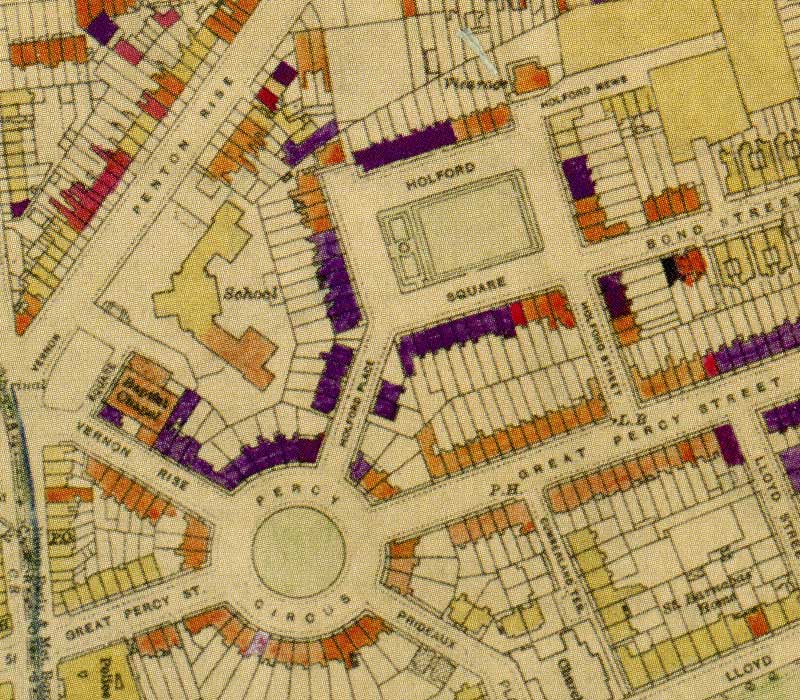
The Bomb Damage Map of Percy Circus and Holford Square
The Colour Key to the L.C.C. Bomb Damage Map
| Colour Key References | ||
| Black -Total destruction | ||
| Purple - Damaged beyond repair | ||
| Dark Red - Doubtful if repairable | ||
| Light Red - Seriously damaged, but repairable at cost | ||
| Orange - General blast damage, not structural | ||
| Yellow - Blast damage, minor in nature | ||
| O | V1 flying bomb | large circle |
| o | V2 long range rocket. | small circle |
There will be slight variations in the colours because the original maps are old and the colour balance on computer monitors will vary |
||
Uses of the Bombing Map on this website
Percy Circus and Bevin Court on the bombsight.org website.
It will open in a new window.
The History of Percy Circus and Holborn Square in Maps
Percy Circus has been set out on a sloping hillside, so that there is a steep climb from South to North.
The area had hardly changed at all it had been built. Then, on 15th May. 1941, almost all the destruction shown in this map occurred. It must have been a truly terrifying night. The details of the damage have been listed above.
One third of all the houses in Percy Circus was damaged beyond repair and by 1955, had been demolished by. The whole of the Holford Square had been demolished so that the site must have been a large bomb site.
The Planning Decision
Both Percy Circus and Holford Square had been badly damaged but it was decided to restore the former and completely demolish the second. Presumably the Road pattern of Percy Circus was too important to lose, while Holford Square could be skirted with no loss to traffic flow.


